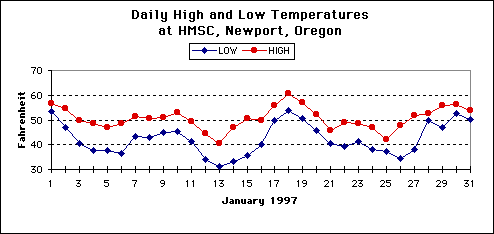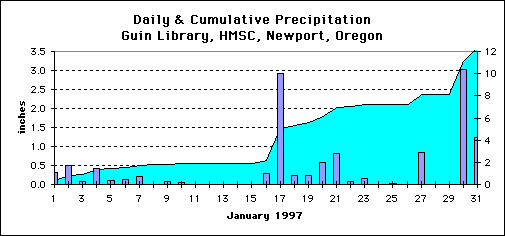
The following table is a preliminary summary of weather data from theGuin Library Weather Station at the Hatfield Marine Science Center in Newport,Oregon.
|
Low Temperature |
High Temperature |
Wind |
Barometric Pressure |
Precipitation |
|||||||
|---|---|---|---|---|---|---|---|---|---|---|---|
|
Date |
Temp |
Time |
Temp |
Time |
Gust |
Dir |
Time |
Press |
Time |
Precip |
N_int |
|
1/1/97 |
53.4 |
2400 |
56.8 |
30 |
57 |
S |
15 |
29.336 |
15 |
0.32 |
8 |
|
1/2/97 |
46.8 |
2400 |
54.8 |
1300 |
37 |
S |
200 |
29.530 |
100 |
0.50 |
15 |
|
1/3/97 |
40.4 |
2400 |
49.6 |
1530 |
33 |
W |
115 |
29.774 |
30 |
0.07 |
4 |
|
1/4/97 |
37.7 |
815 |
48.7 |
1500 |
20 |
NNW |
1545 |
30.170 |
1415 |
0.42 |
12 |
|
1/5/97 |
37.5 |
2400 |
46.9 |
1600 |
13 |
ENE |
2230 |
30.240 |
30 |
0.10 |
5 |
|
1/6/97 |
36.5 |
330 |
48.7 |
2130 |
22 |
S |
1630 |
30.449 |
1530 |
0.12 |
10 |
|
1/7/97 |
43.4 |
2400 |
51.5 |
1630 |
13 |
S |
215 |
30.397 |
2215 |
0.22 |
12 |
|
1/8/97 |
42.8 |
230 |
50.5 |
1530 |
15 |
E |
1345 |
30.259 |
2315 |
0.01 |
1 |
|
1/9/97 |
44.9 |
830 |
51.2 |
2130 |
27 |
S |
1715 |
30.255 |
1700 |
0.07 |
7 |
|
1/10/97 |
45.5 |
2345 |
52.9 |
1445 |
14 |
SW |
30 |
30.037 |
2330 |
0.05 |
5 |
|
1/11/97 |
41.5 |
715 |
49.5 |
1600 |
17 |
ENE |
1000 |
29.869 |
1630 |
0.00 |
0 |
|
1/12/97 |
34.2 |
2400 |
44.4 |
245 |
34 |
ENE |
645 |
29.880 |
130 |
0.01 |
1 |
|
1/13/97 |
31.3 |
845 |
40.5 |
1445 |
35 |
ENE |
1515 |
29.887 |
1600 |
0.00 |
0 |
|
1/14/97 |
33.3 |
815 |
47.0 |
1530 |
22 |
E |
530 |
29.971 |
30 |
0.00 |
0 |
|
1/15/97 |
35.5 |
815 |
50.5 |
1600 |
22 |
ENE |
930 |
30.016 |
215 |
0.00 |
0 |
|
1/16/97 |
40.0 |
1015 |
49.6 |
2400 |
24 |
ENE |
430 |
29.988 |
1415 |
0.28 |
23 |
|
1/17/97 |
49.6 |
15 |
55.8 |
400 |
35 |
SSE |
330 |
30.002 |
400 |
2.92 |
82 |
|
1/18/97 |
53.9 |
215 |
60.9 |
1445 |
38 |
SSE |
615 |
29.939 |
2130 |
0.24 |
8 |
|
1/19/97 |
50.8 |
2400 |
57.2 |
30 |
19 |
S |
645 |
29.768 |
2400 |
0.25 |
22 |
|
1/20/97 |
45.7 |
2400 |
52.3 |
1445 |
37 |
SSE |
1915 |
29.693 |
700 |
0.58 |
27 |
|
1/21/97 |
40.5 |
2400 |
45.7 |
15 |
21 |
SSE |
345 |
29.753 |
145 |
0.81 |
36 |
|
1/22/97 |
39.3 |
845 |
49.1 |
1530 |
14 |
E |
615 |
29.908 |
15 |
0.07 |
7 |
|
1/23/97 |
41.5 |
2300 |
48.7 |
1445 |
28 |
NW |
1530 |
29.971 |
15 |
0.17 |
10 |
|
1/24/97 |
37.9 |
745 |
47.0 |
1515 |
15 |
ENE |
2400 |
29.816 |
2400 |
0.01 |
1 |
|
1/25/97 |
37.2 |
2400 |
42.0 |
1515 |
24 |
ENE |
1100 |
29.498 |
1345 |
0.03 |
3 |
|
1/26/97 |
34.4 |
830 |
47.8 |
1500 |
31 |
ENE |
1745 |
29.627 |
30 |
0.00 |
0 |
|
1/27/97 |
38.1 |
345 |
51.9 |
2400 |
29 |
SSW |
2215 |
29.941 |
1900 |
0.83 |
32 |
|
1/28/97 |
49.9 |
2400 |
52.8 |
1215 |
19 |
SSW |
15 |
30.070 |
45 |
0.01 |
1 |
|
1/29/97 |
47.0 |
830 |
56.0 |
2330 |
32 |
S |
2330 |
30.139 |
2245 |
0.00 |
0 |
|
1/30/97 |
52.7 |
945 |
56.1 |
230 |
40 |
S |
230 |
29.900 |
2400 |
3.02 |
80 |
|
1/31/97 |
50.1 |
2345 |
53.8 |
15 |
31 |
S |
45 |
29.831 |
945 |
1.23 |
53 |
|
Monthly |
|||||||||||
|
Min |
31.3 |
29.3 |
|||||||||
|
Max |
60.9 |
57.0 |
82 |
||||||||
|
Total |
12.34 |
||||||||||
Date 0005 - 2400 hours on the day indicated.Low Lowest Air Temperature of the day and TIME at which it occurred.High Highest Air Temperature of the day and TIME at which it occurred.Gust Highest wind gust and TIME at which it occurred.Dir Direction from which the wind was blowing.Press Lowest barometric pressure (inches) and TIME at which it occurred.Precip Total precipitation for the day from a Tipping bucket device.N_int Number of 15 minute intervals in which some precipitation occurred.

Top of Page
