2000 Yearly Summary
Climatology
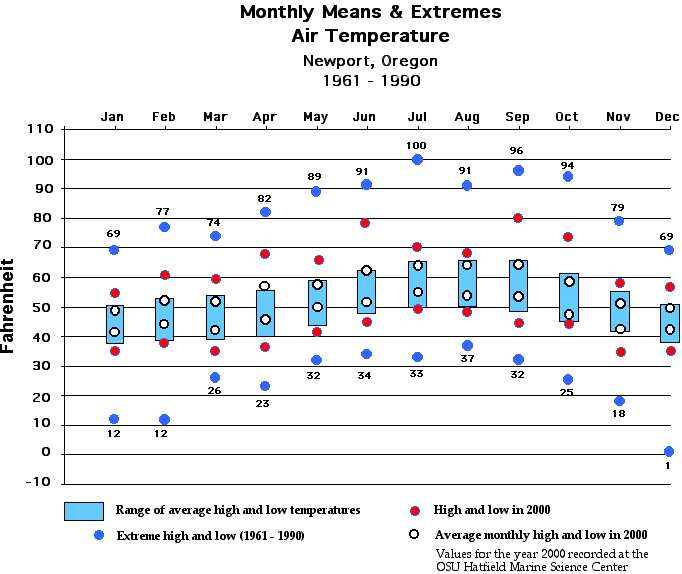
Air temperatures recorded at the OSU Hatfield Marine Science Center in 2000 compared to the average and extremes for the City of Newport during the years 1961 - 1990.
Table
The following table is a preliminary summary of weather data from the Guin Library Weather Station at the Hatfield Marine Science Center in Newport, Oregon.
|
Mo |
LoTemp |
HiTemp |
Gust |
LoPress |
HiPress |
MoRain |
CumRain |
|
Jan |
35.5 |
54.6 |
70 |
29.35 |
30.61 |
14.76 |
14.76 |
|
Feb |
38.3 |
60.5 |
46 |
29.27 |
30.36 |
11.53 |
26.29 |
|
Mar |
35.6 |
59.7 |
35 |
29.79 |
30.54 |
5.80 |
32.09 |
|
Apr |
37.6 |
67.8 |
32 |
29.74 |
30.43 |
3.47 |
35.56 |
|
May |
41.5 |
65.2 |
32 |
29.80 |
30.37 |
3.97 |
39.53 |
|
Jun |
44.9 |
79.8 |
51 |
29.84 |
30.41 |
2.75 |
42.28 |
|
Jul |
49.2 |
70.0 |
30 |
29.95 |
30.29 |
0.36 |
42.64 |
|
Aug |
48.5 |
67.6 |
31 |
29.88 |
30.32 |
0.19 |
42.83 |
|
Sep |
45.0 |
80.0 |
39 |
29.67 |
30.34 |
1.36 |
44.19 |
|
Oct |
43.3 |
73.2 |
40 |
29.43 |
30.39 |
4.59 |
48.78 |
|
Nov |
34.3 |
58.8 |
37 |
29.56 |
30.48 |
4.38 |
53.16 |
|
Dec |
35.8 |
57.4 |
57 |
29.57 |
30.69 |
4.92 |
58.08 |
|
Year |
34.3 |
80.0 |
70 |
29.27 |
30.69 |
|
|
Legend
MO           Month
LoTemp       Lowest Air Temperature of the month.
HiTemp       Highest Air Temperature of the month.
Peak Wind    Highest wind for the month in miles per hour.
LoPress      Lowest barometric pressure (inches) for the month.
HiPress      Highest barometric pressure (inches) for the month.
MoRain       Total precipitation for the month from a Tipping bucket device.
CumRain      Cumulative precipitation for the year.
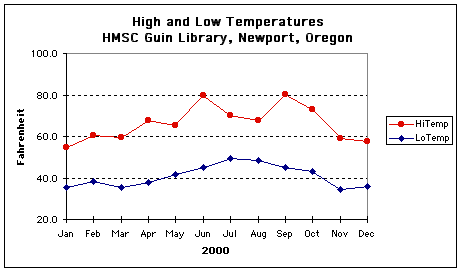
High and Low Temperature
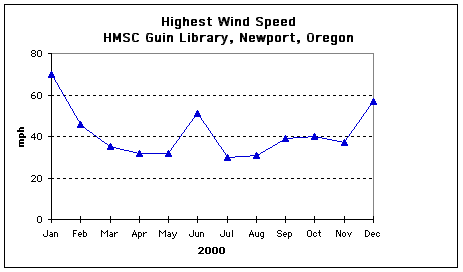
Peak Wind
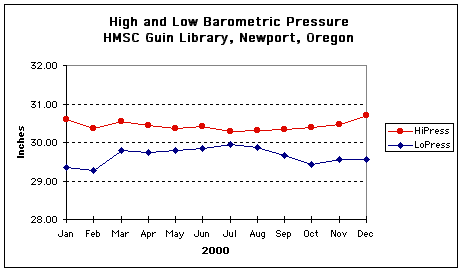
Barometric Pressure
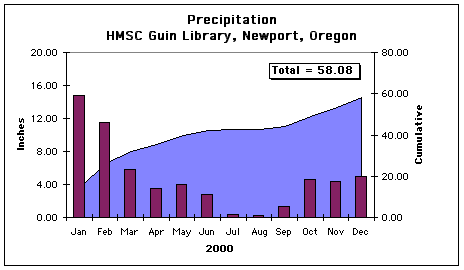
Precipitation
Document URL:http://www.hmsc.oregonstate.edu/weather/summaries/guinlib/2000/year2000.html
Document Coordinator: hmscweather@oregonstate.edu
